Nonprofit5 min read
Stone Steps 50K
Stone Steps 50K
A rebuild for Cincinnati's longest-running ultramarathon: every result since 2003, records calculated from them, and a 3D map of the course measured from a real run.
Outcome
Twenty-three years of results in one place, with records the site calculates itself, so a record can never disagree with the finish behind it.
Role: Designer, Developer
Built with: Astro, Sanity, Cloudflare Workers, MapLibre GL, RunSignUp API
- Strategy
- Web Design
Tags: Trail Running, Events, Records Database, Interactive Map


The brief
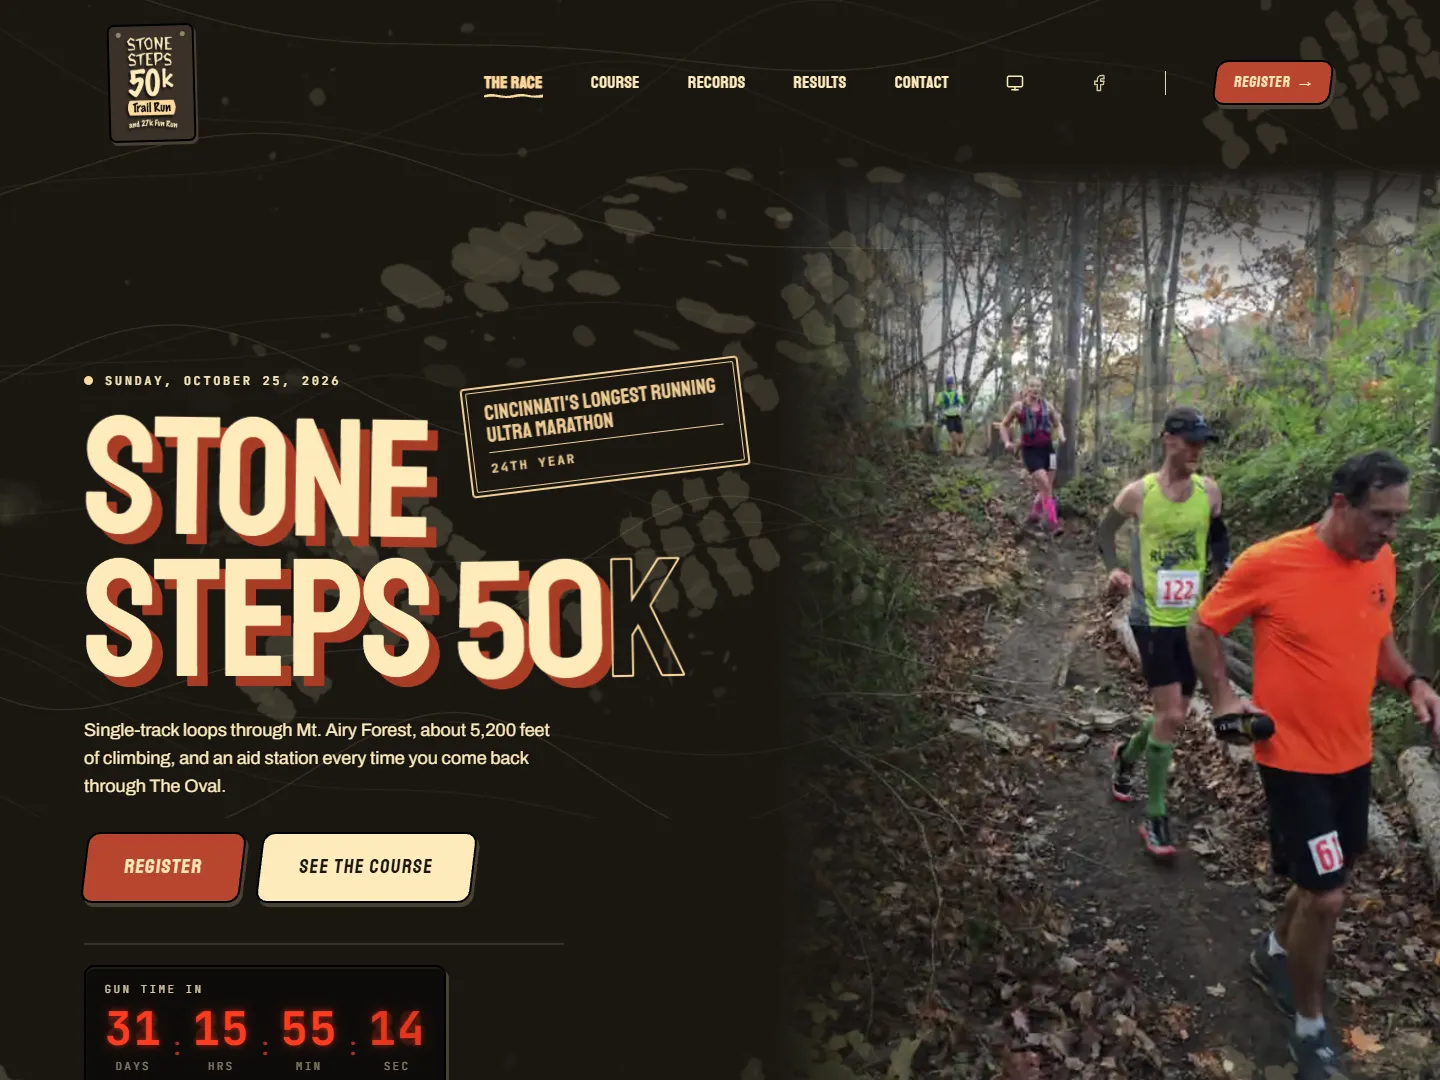
The Stone Steps 50K is a trail ultramarathon through Mt. Airy Forest in Cincinnati: seven loops out of The Oval, a 27K for runners who want four, and a loyal community that has come back every October since 2003. Race director David Corfman has run it for most of that time.
I built the race’s first real website in 2024, on WordPress. It gave the race a home, but two years on its weak spots were clear. The records lived in hand-typed tables that had started to contradict each other. The course was summed up by a single elevation figure with no measurement behind it written down anywhere.
So the brief for version two was about trust as much as looks. Every number on the site should come from a source you can point to, the history should be complete, and the site should keep itself current after each race without anyone typing anything in.
BeforeAfter
What changed, and why
The records come from the results
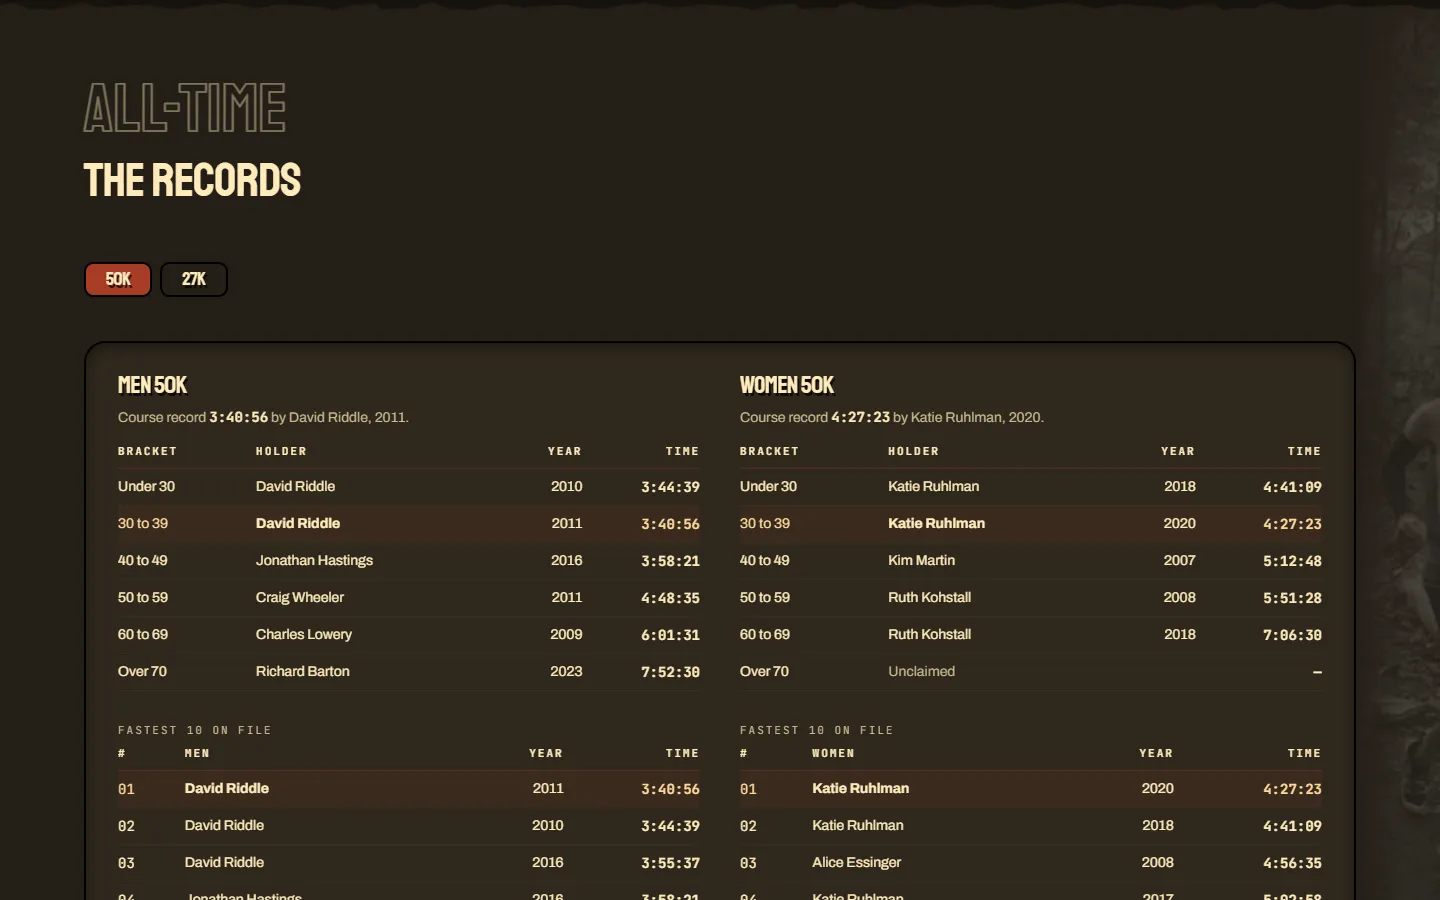
On the old site, records were tables someone typed in and kept up by hand, which is how the same 1:58:36 ended up listed under both 2010 and 2011. The rebuild starts from the results instead. Every finish since 2003 is its own entry, with the time stored as a number and the finish linked to a runner profile. Course records, age-group records, and the top-ten lists are all calculated from those entries.
That meant finding the results first. The recent years came straight from RunSignUp’s public API. The early ones came from the race’s archived results pages, and every year was re-checked against its source. That check caught real mistakes: an importer that misread one year’s column for sex and left 2004 without its three women, and twelve old 27K “records” that matched no finish in any year. Those came off the board, and the question of where they came from went back to Dave.
 BeforeAfter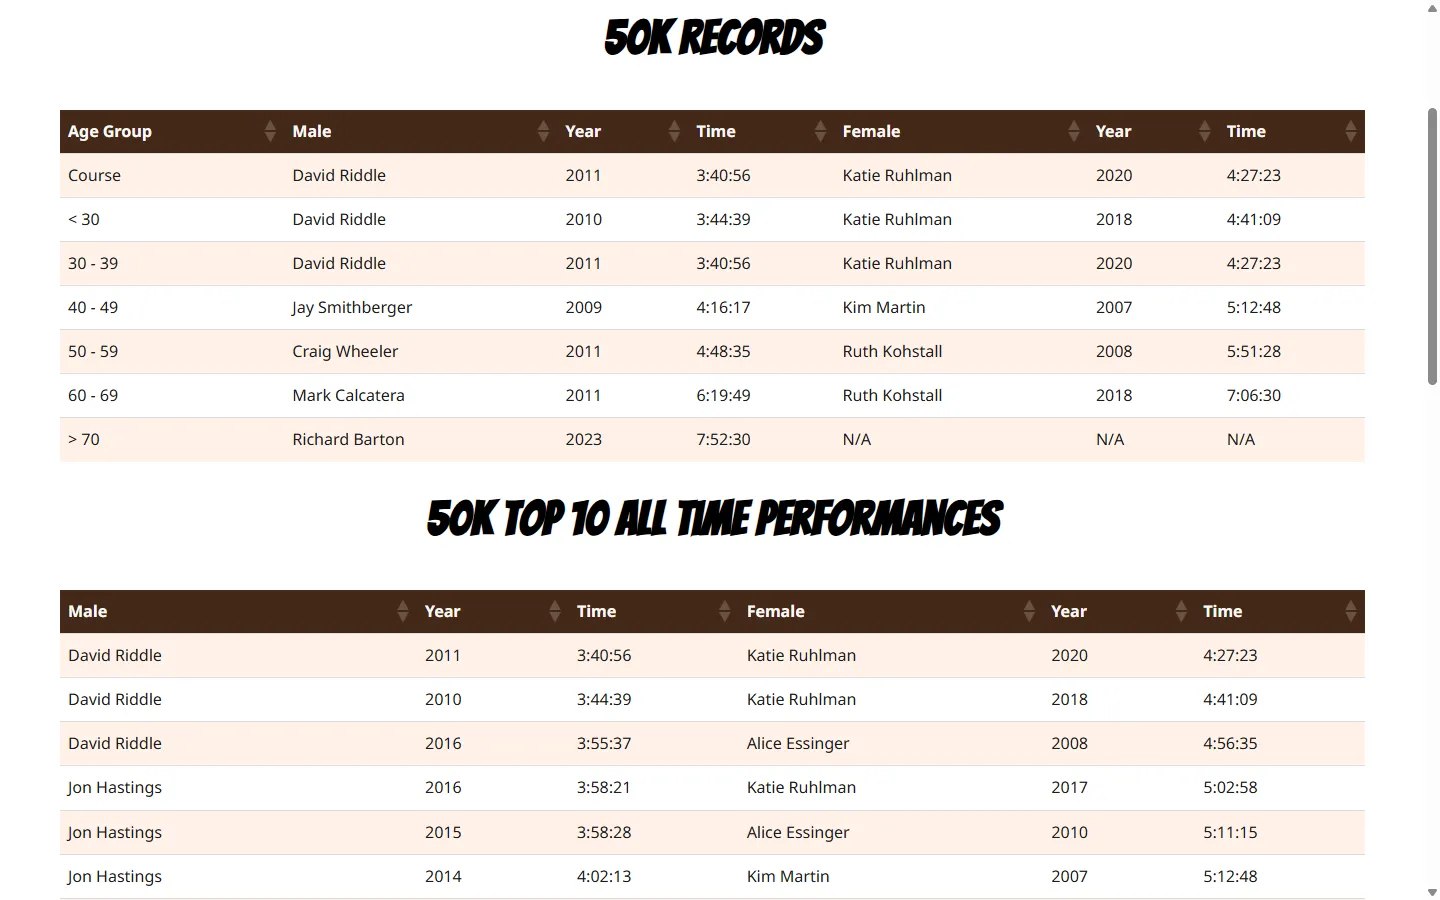
The course, measured instead of described
The old course section was a race photo, a scan of the park’s trail map, and a paragraph of loop directions, with “10,726 feet” as the total elevation change. Nobody had written down where that number came from.
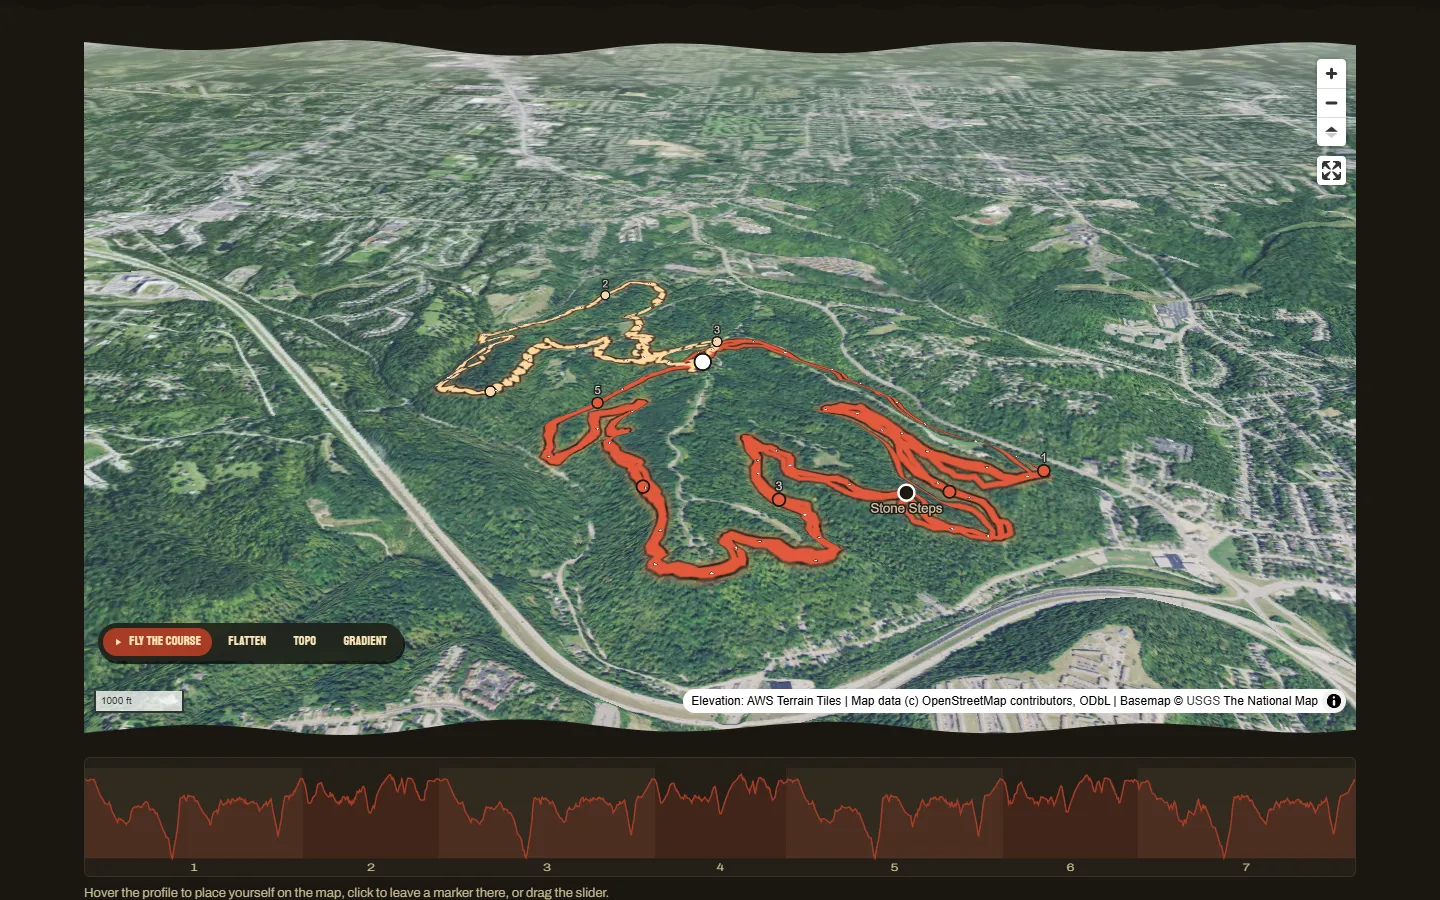
The new course map is drawn from Dave’s own recorded run of the course, on real 3D terrain with aerial imagery. Visitors can drag it, tilt it, switch between satellite and topo, color the route by steepness, and fly the whole course. The elevation profile below the map doubles as a scrubber, so hovering over a climb shows exactly where it is on the course. The climbing figure is measured too: about 5,200 feet of climbing, from USGS 1-meter LiDAR along that same track, with the method stated right next to the chart.
 BeforeAfter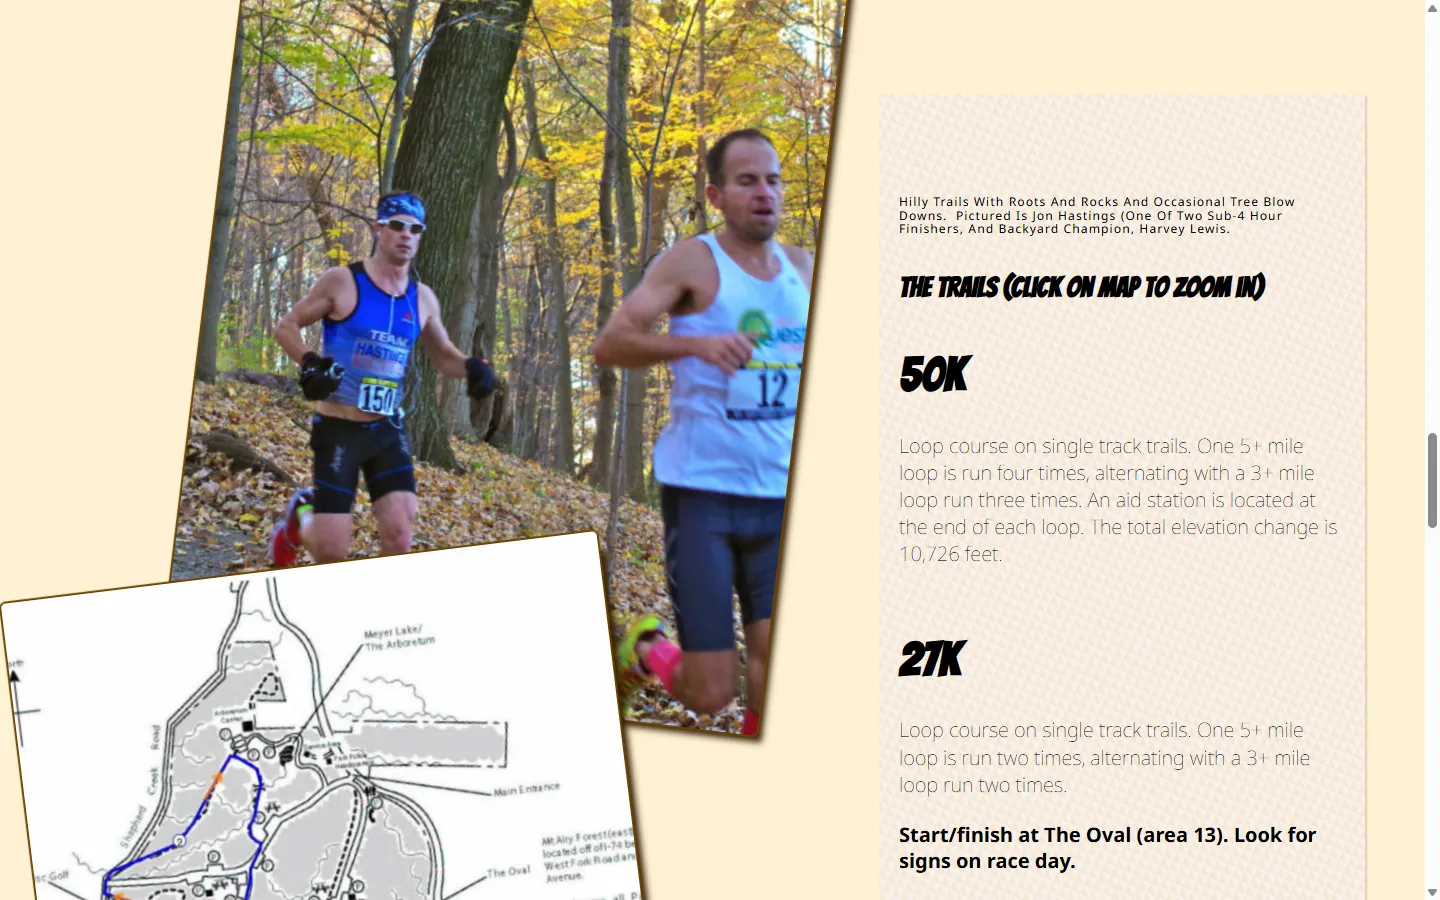
A look taken from the race’s own sign
The race logo is a hand-painted trail sign in cream and gold, so that is where the new identity starts. The palette is sampled from the logo file. Buttons are sign plates. Course records are names stamped onto a bark board, and each year’s results page is laid out like a timing sheet on a clipboard. The first draft of the design used a near-black and blaze orange scheme that looked like a trail race. It got thrown out because it didn’t look like this one.
A site that keeps itself current
Race details live in a Sanity Studio that Dave can edit himself, with a checklist for rolling the site over to a new year. After each race, a nightly job pulls the new results from RunSignUp, and by the next morning the results page, the records, the runner pages, and the edition count are all up to date. The contact form delivers straight to the race director’s inbox, and the whole site moved onto Cloudflare along with its domain. Every change is checked against a perfect Lighthouse accessibility score, and the check fails if it drops.
What we built
The names on the board
The four course records, men's and women's for both distances, stamped onto a bark board. It is calculated from the results like everything else, so it changes on its own the morning after someone breaks a record.
A stack of saw teeth
The elevation profile of all seven loops, with each return to the aid station marked. The source is written right under the chart: USGS 1-meter LiDAR along a recorded run of the course.
What the weather has done
Every race morning since 2003 as a temperature range, with rain on the day and rain the night before marked. It replaces the live forecast widget from the first version with something only this race has, and it adds each new year on its own.
The full build:
- Homepage with the race date, a countdown to the gun, both distances with their fees and start times, and registration through RunSignUp
- Interactive 3D course map with a flyover, satellite and topo views, a steepness view, and an elevation scrubber
- A results page for every year from 2003 to 2025, plus a page for each runner showing every finish on file
- All-time records and top-ten lists for both distances, calculated from the results
- Historical race-day weather for every edition
- Parking and directions to the start, and a contact form that goes straight to the race director
- A Sanity Studio for the race director, with automatic results imports after each race
What changed
- Every edition since 2003 has its own results page, 2,188 finishes in all, recovered from RunSignUp and the race’s archived results pages and checked year by year against their sources.
- Records are calculated from those results instead of typed into tables, so a record and the finish behind it are the same entry. The old site had drifted: it listed one 1:58:36 under two different years, and spelled one runner two ways.
- The climbing figure now has a measurement behind it: about 5,200 feet, taken from USGS LiDAR along the race director’s own recorded run of the course.
- After each race the site updates itself. Results, records, and runner pages are live the next morning, and nobody has to touch anything.